Introduction
Graphs are a powerful tool for representing data and sharing information. In science, graphs are used to illustrate research findings, trends, patterns, and other important data points. They allow scientists to quickly and easily interpret complex data sets and identify relationships between different variables. This article will explore why graphs are important in science and the benefits they provide for researchers.

How Graphs Help Scientists Visualize Data
Graphs are a visual representation of data that can be used to convey information more clearly than text alone. They help to make complex data sets more understandable and easier to interpret. There are several types of graphs used in science, including bar graphs, line graphs, and pie charts. Each type of graph has its own unique features and can be used to represent different types of data.
Examples of How Graphs are Used to Represent Scientific Ideas
Graphs are used in many areas of science to represent research findings, trends, and patterns. For example, a bar graph might be used to compare the amount of rainfall in different regions over a period of time. A line graph could be used to show the temperature of the Earth’s atmosphere over time. A pie chart could be used to display the percentage of different elements in a chemical compound. Graphs are also used to display the results of experiments or surveys.
The Benefits of Using Graphs to Represent Scientific Ideas
Graphs are an invaluable tool for scientists as they allow them to quickly and easily interpret complex research findings. By displaying data visually, graphs make it easier to identify trends and patterns that may not be apparent in text-based descriptions. Graphs also allow scientists to make comparisons between different variables and draw conclusions about their research.

Exploring the Variety of Graphs Used in Science
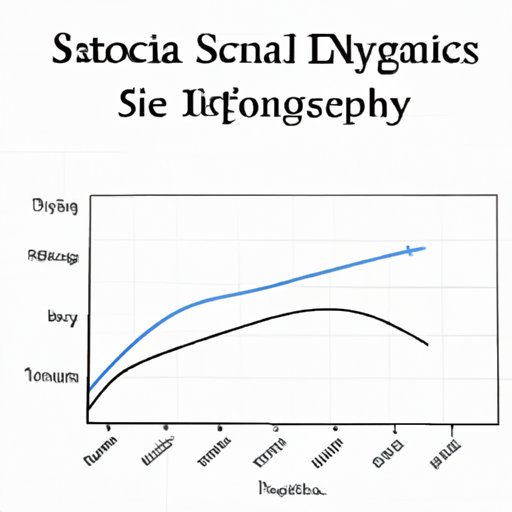
Bar graphs are used to compare values between two or more categories. They can be used to show the differences between groups or to compare the same group over time. Line graphs are used to show changes in data over time. They can be used to show trends or patterns in data and are often used to display the results of experiments or surveys. Pie charts are used to show the proportions of different values within a single category. They are often used to show the breakdown of a population into different groups or to compare the relative sizes of different parts of a whole.
Examining the Influence of Graphs on Scientific Progress
Graphs have had a major influence on scientific progress. They allow scientists to quickly and easily identify trends and patterns in data that may otherwise go unnoticed. By making complex research findings accessible, graphs enable scientists to make new discoveries and further their understanding of the world around us. Graphs also allow scientists to share their research with a wider audience, making scientific discoveries accessible to people who may not have the technical knowledge to understand the underlying data.
Conclusion
Graphs are an essential tool for scientists to represent their research findings and have a major influence on scientific progress. They allow scientists to quickly and easily interpret complex data sets, identify trends and patterns, and make scientific discoveries accessible to a wider audience. From bar graphs to pie charts, there is a wide variety of graphical representations that can be used to represent scientific ideas. Ultimately, graphs provide a powerful way for scientists to visualize data and share their findings with the world.
(Note: Is this article not meeting your expectations? Do you have knowledge or insights to share? Unlock new opportunities and expand your reach by joining our authors team. Click Registration to join us and share your expertise with our readers.)