Introduction
A line graph is a type of chart that uses lines to represent data points. It is one of the most commonly used charts in science because it can easily display changes over time and compare different data sets. This article will explore what a line graph is and how it is used in science. It will provide an overview of the basics of line graphs, a comprehensive guide to understanding them, and examples of how they are used for data visualization and scientific research.
Exploring the Basics of Line Graphs in Science
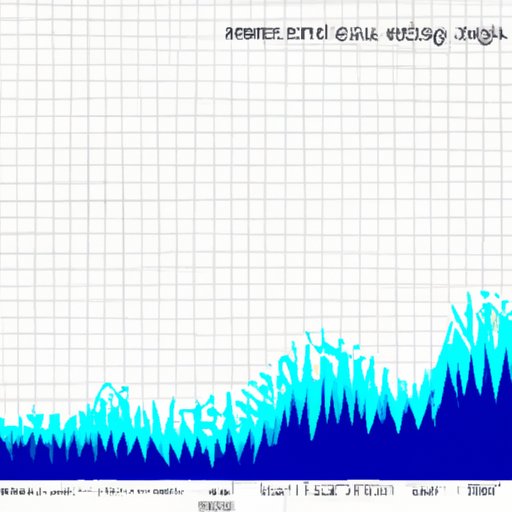
Line graphs are used to visually display data in a way that is easy to understand. They are typically used when trying to measure changes over time or compare different data sets. Line graphs can be used to show trends, patterns, and relationships between two or more variables. They are also useful for displaying data from experiments or surveys.
There are several types of line graphs that can be used in science. The most common types are linear, logarithmic, and semi-logarithmic line graphs. Each type has its own advantages and disadvantages, so it is important to choose the right type for the data being displayed. For example, linear line graphs are best for displaying data that is evenly spaced over time, while logarithmic line graphs are best for displaying data with large variations.
The basic components of a line graph include the title, axes, labels, data points, and lines. The title should clearly describe the data being displayed, while the axes should be labeled with both the independent and dependent variables. The labels should indicate the units of measurement, while the data points should be plotted along the axes. Finally, the lines should connect the data points to create the graph.
Line graphs have both advantages and disadvantages. On the one hand, they are easy to read and interpret, which makes them a great choice for displaying data. On the other hand, they can be difficult to construct, especially if the data points are not evenly spaced. Additionally, line graphs do not always accurately reflect the data, as the lines may not follow the exact pattern of the data points.
A Comprehensive Guide to Understanding Line Graphs in Science
Constructing a line graph can seem daunting, but it is actually quite simple once you understand the basic steps. First, decide which type of line graph is best suited for the data being displayed. Then, collect the data and plot the points along the axes. Next, label the axes with the independent and dependent variables and their units of measurement. Finally, connect the data points with lines to create the graph.
Interpreting line graphs is often easier than constructing them. When looking at a line graph, the first thing to look for is any patterns or trends. Are the lines going up or down? Are there any unusual spikes or dips in the data? Are the lines evenly spaced or jagged? These can all help to determine the overall trend of the data.
It is also important to consider the context of the data. Does the data make sense given the context? Are there any outliers that could skew the results? Are there any potential biases that could affect the interpretation of the data? Answering these questions can help to ensure that the data is interpreted correctly.

Utilizing Line Graphs in Scientific Research
Line graphs can be used in scientific research to display data from experiments or surveys. For example, a scientist might use a line graph to show the results of a survey on public opinion about a certain topic. The data points would be plotted along the axes, and the lines would indicate the overall trend. Line graphs can also be used to compare different data sets, such as the results of two different experiments.
Using line graphs in scientific research has several benefits. First, they are easy to read and interpret, making it easier to draw conclusions from the data. Second, they can help to identify patterns or trends that may not be immediately apparent. Finally, line graphs can help to visualize complex data sets, making it easier to spot relationships between variables.
How Line Graphs Enhance Data Visualization in Science
Data visualization is an important part of scientific research. It helps scientists to quickly identify patterns and relationships in data sets, which can then be used to make informed decisions. Line graphs are particularly effective for data visualization because they can easily display changes over time and compare multiple data sets.
Line graphs are also effective for visualizing large data sets. By connecting the data points with lines, it is easier to spot relationships between variables. Additionally, line graphs can be used to highlight outliers or anomalies in the data, making it easier to identify potential problems or areas of further research.

An Overview of Line Graphs and Their Applications in Science
Line graphs are a powerful tool for analyzing data in science. They can be used to measure changes over time, compare different data sets, and visualize large data sets. They are also useful for identifying patterns and trends in data, which can help scientists to draw meaningful conclusions from their research.
Line graphs come in several different types, each with its own advantages and disadvantages. It is important to choose the right type for the data being displayed. Additionally, it is important to ensure that the data is interpreted correctly by considering the context of the data and looking for any potential biases.
Conclusion
In conclusion, line graphs are an essential tool for analyzing data in science. They can be used to measure changes over time, compare different data sets, and visualize large data sets. They are also useful for identifying patterns and trends in data, which can help scientists to draw meaningful conclusions from their research. Line graphs come in several different types, so it is important to choose the right type for the data being displayed.
By following the steps outlined in this article, scientists can easily construct and interpret line graphs. With a little practice, line graphs can become a powerful tool for analyzing data and drawing meaningful conclusions from scientific research.
(Note: Is this article not meeting your expectations? Do you have knowledge or insights to share? Unlock new opportunities and expand your reach by joining our authors team. Click Registration to join us and share your expertise with our readers.)