Introduction
Financial charts are graphical representations of a security’s price movements over a certain period of time. They can be used by investors to gain insight into potential opportunities in the market. In this article, we will explore how to read financial charts in order to make informed decisions about investments.
Identify the Chart Type
There are three main types of financial charts: line graphs, bar graphs, and candlestick charts. Each one provides different information about a security’s price movements.
Line Graphs
A line graph is a simple way to show the general direction of a security’s price movements over a period of time. The vertical axis shows the price of the security, while the horizontal axis shows the time period. Line graphs are useful for quickly identifying trends in the market.
Bar Graphs
A bar graph is similar to a line graph, but it also provides additional information about the security’s price movements. The vertical axis still shows the price of the security, while the horizontal axis shows the time period. The bars on the graph represent the range of prices at which the security traded during each time period.
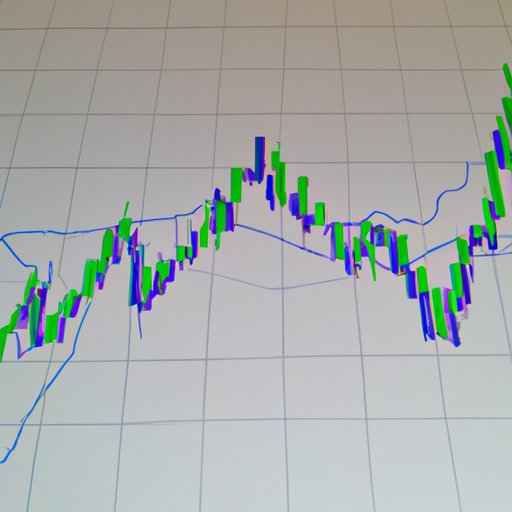
Candlestick Charts
Candlestick charts provide more detailed information about a security’s price movements than line or bar graphs. The vertical axis still shows the price of the security, while the horizontal axis shows the time period. The body of the candlestick represents the range of prices at which the security traded during each time period. The wicks above and below the body of the candlestick represent the high and low prices during the time period.
Understand the Time Period
It is important to understand the time period shown on the chart. This will help you identify any patterns or trends that may have occurred over the course of the time period. For example, if the chart is showing weekly data, you may be able to identify seasonal trends. If the chart is showing daily data, you may be able to identify intraday trends.
Analyze the Trend
The next step is to analyze the trend of the security’s price movements. An upward trend indicates that the security’s price has been increasing over the time period shown, while a downward trend indicates that the security’s price has been decreasing. Identifying the trend can help you make informed decisions about when to buy and sell the security.
Note Relevant Events
It is also important to look for news events that may have impacted the financial market during the time period shown on the chart. These events could include economic reports, government announcements, or corporate earnings. Knowing what events occurred during the time period can give you insight into why the security’s price moved in a certain direction.
Utilize Indicators
In addition to analyzing the trend of the security’s price movements, you can also utilize various indicators to gain further insight. Moving averages, support and resistance levels, and volume are all indicators that can provide valuable information about a security’s price movements. Looking at these indicators can help you make more informed decisions about when to buy and sell the security.
Make Predictions
Finally, you can use the information from the chart to make predictions about future price movements. By looking at the trend of the security’s price movements as well as any news events or indicators that may have impacted the market, you can make educated guesses about where the security’s price is likely to go in the future.
Conclusion
Reading financial charts is an essential skill for any investor. By understanding the different types of charts, understanding the time period shown, analyzing the trend, noting relevant events, utilizing indicators, and making predictions, you can gain valuable insight into potential opportunities in the market.
(Note: Is this article not meeting your expectations? Do you have knowledge or insights to share? Unlock new opportunities and expand your reach by joining our authors team. Click Registration to join us and share your expertise with our readers.)