Introduction
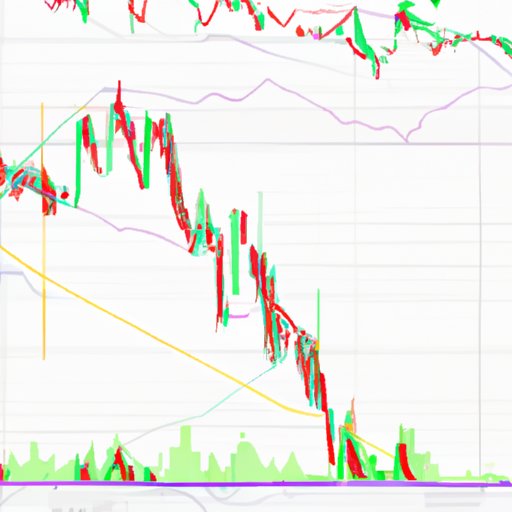
Cryptocurrency investors and traders often rely on charts to make informed decisions about when to buy and sell digital assets. Charts provide a visual representation of price changes over time, which can help traders identify trends and make predictions about future price movements. In this article, we’ll explore how to read crypto charts and use them to your advantage.
Understand the Different Types of Crypto Charts
Before diving into chart interpretation, it’s important to understand the different types of crypto charts available. Each type offers a unique view of the market, so it’s important to choose the right chart for your trading strategy.
Candlestick Charts
Candlestick charts are one of the most popular types of crypto charts. They display the open, close, high, and low prices for a given period of time. The body of the candlestick is represented by the open and close prices. The shadows above and below the body represent the high and low prices. Candlestick charts are useful for identifying short-term price movements and trends.
Line Charts
Line charts are simple and easy to interpret. They show the closing price of an asset over a given period of time. Line charts are useful for identifying long-term price trends, but they don’t provide much detail about short-term price movements.
Bar Charts
Bar charts are similar to candlestick charts, but they display the open, close, high, and low prices in separate columns. Bar charts are useful for identifying both long-term and short-term price trends.
Renko Charts
Renko charts are created by plotting a set number of pips (price movements) on the y-axis. This type of chart ignores time, making it easier to identify support and resistance levels. Renko charts are useful for spotting trend reversals and breakouts.
Heikin-Ashi Charts
Heikin-Ashi charts are similar to candlestick charts, but they smooth out some of the noise associated with short-term price movements. Heikin-Ashi charts are useful for identifying long-term trends and filtering out short-term noise.
Kagi Charts
Kagi charts are based on the opening and closing prices of an asset. The chart plots a line when the closing price exceeds the previous closing price, and plots a new line when the closing price falls below the previous closing price. Kagi charts are useful for spotting long-term trends and breakouts.
Point and Figure Charts
Point and figure charts ignore time and focus solely on price movements. These charts consist of Xs and Os, with Xs representing rising prices and Os representing falling prices. Point and figure charts are useful for identifying long-term trends and support and resistance levels.
Learn How to Interpret Technical Indicators
In addition to understanding the different types of crypto charts, it’s also important to learn how to interpret technical indicators. Technical indicators are tools used to analyze price movements and identify potential trading opportunities. Here are some of the most commonly used technical indicators.
Moving Averages
A moving average is an indicator that shows the average price of an asset over a given period of time. Moving averages are used to identify long-term trends and support and resistance levels. They can also be used to generate trading signals.
Bollinger Bands
Bollinger bands show the volatility of an asset. The bands expand when volatility is high and contract when volatility is low. Bollinger bands are useful for identifying potential breakouts and reversals.
Relative Strength Index (RSI)
The relative strength index (RSI) is a momentum indicator that measures the magnitude of recent price changes. The RSI is used to identify potential overbought and oversold conditions. It can also be used to generate trading signals.
Stochastic Oscillator
The stochastic oscillator is a momentum indicator that compares the closing price to the range of prices over a given period of time. The oscillator is used to identify potential overbought and oversold conditions. It can also be used to generate trading signals.
Average Directional Movement Index (ADX)
The average directional movement index (ADX) is a trend indicator that measures the strength of a trend. The ADX is used to identify whether a trend is strong or weak. It can also be used to generate trading signals.
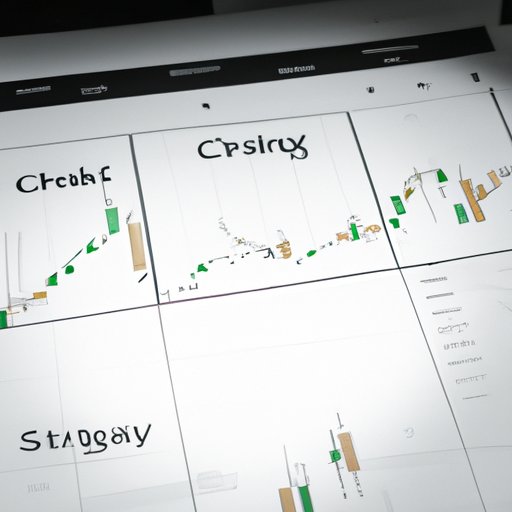
Utilize Charting Patterns for Market Analysis
Charting patterns are formations that occur on a chart that may indicate a potential trading opportunity. Here are some of the most common charting patterns.
Head and Shoulders
The head and shoulders pattern is a reversal pattern that indicates a potential trend reversal. The pattern consists of three peaks, with the middle peak being the highest. This pattern is used to identify potential trend reversals.
Double Tops and Bottoms
Double tops and bottoms are reversal patterns that indicate a potential trend reversal. A double top consists of two consecutive peaks followed by a decline, while a double bottom consists of two consecutive troughs followed by a rally. These patterns are used to identify potential trend reversals.
Rising Wedge and Falling Wedge
Rising wedges and falling wedges are continuation patterns that indicate a potential trend continuation. A rising wedge consists of two converging trend lines that slope upward, while a falling wedge consists of two converging trend lines that slope downward. These patterns are used to identify potential trend continuations.
Flag and Pennant
Flags and pennants are continuation patterns that indicate a potential trend continuation. A flag consists of two parallel trend lines that slope against the prevailing trend, while a pennant consists of two converging trend lines that slope against the prevailing trend. These patterns are used to identify potential trend continuations.
Monitor Trends and Volatility
In addition to understanding charting patterns, it’s also important to monitor trends and volatility. Monitoring trends and volatility can help traders identify potential trading opportunities.
Identifying Trend Reversals
Trend reversals occur when the prevailing trend changes direction. Traders can identify trend reversals by looking for charting patterns such as head and shoulders or double tops and bottoms. They can also look for divergence between price and technical indicators such as the RSI or MACD.
Measuring Volatility with ATR
Volatility is a measure of how much an asset’s price moves over a given period of time. The average true range (ATR) is an indicator that measures volatility. The ATR can help traders identify potential breakouts and reversals.
Analyze Volume and Liquidity
Volume and liquidity are important factors to consider when analyzing crypto charts. Volume is a measure of how many trades have occurred over a given period of time, while liquidity is a measure of how easily an asset can be bought and sold.
Volume as an Indicator of Momentum
Volume is an important indicator of momentum. Increasing volume usually indicates increasing momentum, while decreasing volume usually indicates decreasing momentum. Traders can use volume to identify potential trading opportunities.
Liquidity and Its Impact on Price
Liquidity is an important factor to consider when analyzing crypto charts. Low liquidity can lead to large price swings, while high liquidity can lead to more stable prices. Traders should take liquidity into account when analyzing price movements.
Track Support and Resistance Levels
Support and resistance levels are key areas where price movements are likely to reverse. Identifying these levels can help traders anticipate potential breakouts and reversals.
Determining Support and Resistance
Support and resistance levels can be determined by looking for areas on a chart where price has reversed in the past. Traders can also use technical indicators such as the RSI or MACD to identify potential support and resistance levels.
Using Pivot Points
Pivot points are another way to identify potential support and resistance levels. Pivot points are calculated using the high, low, and closing prices of an asset. Traders can use pivot points to anticipate potential breakouts and reversals.
Practice Reading Charts with Simulated Trading
Once you’ve learned how to read crypto charts, it’s important to practice reading charts with simulated trading. Simulated trading allows traders to practice their skills without risking real money. Here are some tips for successful simulated trading.
Benefits of Simulated Trading
Simulated trading allows traders to practice their skills without risking real money. It also provides traders with the opportunity to test new strategies and develop their own trading style.
Tips for Successful Simulated Trading
When practicing with simulated trading, it’s important to keep a journal of your trades. You should also practice using different types of charts and technical indicators. Finally, don’t be afraid to experiment with different strategies and approaches.
Conclusion
Reading crypto charts is an essential skill for any cryptocurrency trader or investor. This article has explored how to read crypto charts and use them to your advantage. We’ve discussed the different types of charts, technical indicators, charting patterns, trends and volatility, volume and liquidity, and support and resistance levels. We’ve also discussed the benefits of simulated trading and tips for successful simulated trading. With the knowledge gained from this article, you’re now ready to start reading crypto charts and making informed decisions about when to buy and sell digital assets.
(Note: Is this article not meeting your expectations? Do you have knowledge or insights to share? Unlock new opportunities and expand your reach by joining our authors team. Click Registration to join us and share your expertise with our readers.)