Introduction
Financial forecasting is the process of predicting future income and expenses based on current and historical data. It is used by businesses to make informed decisions about their finances and help plan for the future. Financial forecasting in Excel is a great way to streamline this process and make it easier to understand. Excel provides powerful tools and functions that can be used to accurately forecast a business’s financial performance.
What is Financial Forecasting?
Financial forecasting is the practice of predicting future income and expenses based on current and historical data. This data is used to create projections of a company’s financial performance over a certain period of time, such as one year or five years. Financial forecasting helps businesses plan for the future, identify potential risks, and make informed decisions about their finances.

Benefits of Financial Forecasting in Excel
Using Excel to create a financial forecast has many advantages. Excel provides powerful tools and features that make it easy to input and organize data, calculate values, and visualize results. Excel also allows users to automate their spreadsheets, making it easier to stay up-to-date with changing financial conditions. Additionally, Excel’s data visualization tools make it easy to interpret complex financial information and share results with other stakeholders.
Step-by-Step Guide to Creating a Financial Forecast in Excel
Creating a financial forecast in Excel is a straightforward process that involves setting up your spreadsheet, defining your variables, calculating your values, and visualizing your results. Here is a step-by-step guide to creating a financial forecast in Excel:
Setting Up Your Spreadsheet
The first step in creating a financial forecast in Excel is to set up your spreadsheet. Start by creating a new workbook and entering any relevant data into the appropriate columns. For example, you may want to enter monthly sales figures into one column and monthly expenses into another. You can also add additional columns for any other data points that might be relevant to your forecast, such as projected sales growth or expected changes in expenses.
Defining Your Variables
Once you have entered all of your data into the spreadsheet, you will need to define the variables that will be used in your financial forecast. These variables could include things like sales revenue, expenses, taxes, interest payments, and so on. Define each variable and assign it a value so that it can be used in the calculation of your financial forecast.
Calculating Your Values
Now that you have defined your variables, you can begin calculating your values. Excel provides a variety of formulas and functions that can be used to calculate values based on the data you have entered. You can also use statistical functions to analyze your data and make more accurate predictions.
Visualizing Your Results
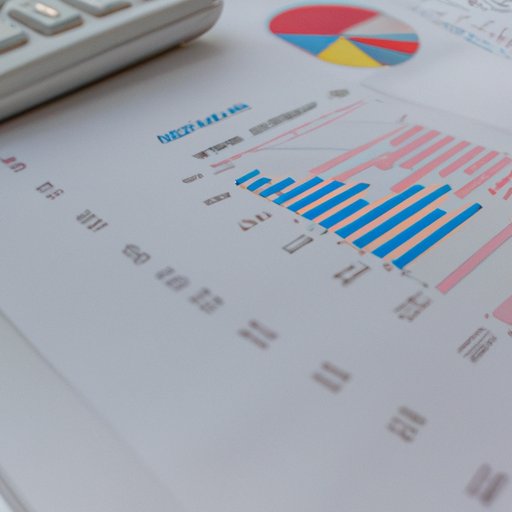
Once you have calculated your values, you can use Excel’s data visualization tools to visualize your results. Excel provides a variety of charts and graphs that can be used to display your data in an easy-to-understand format. This makes it easier to share your results with other stakeholders and get feedback on your forecast.

Tips and Tricks for Financial Forecasting with Excel
Excel provides a variety of tools and features that can be used to create an accurate financial forecast. Here are some tips and tricks for using Excel to create a financial forecast:
Utilizing Formulas
Excel provides a wide range of formulas and functions that can be used to calculate values based on the data you have entered. These formulas can be used to calculate everything from simple arithmetic calculations to more complex statistical analyses. Utilizing these formulas can help you create an accurate financial forecast.
Using Statistical Functions
Excel also provides a variety of statistical functions that can be used to analyze your data and make more accurate predictions. These functions can be used to calculate things like averages, variances, standard deviations, correlations, and more. Using these functions can help you create a more accurate financial forecast.
Exploring Data Visualization Tools
Excel’s data visualization tools make it easy to interpret complex financial information and share results with other stakeholders. These tools include charts, graphs, and other visual representations of data that can be used to quickly and easily convey information. Exploring these data visualization tools can help you create a more effective financial forecast.
Using Excel to Create an Accurate Financial Forecast
Financial forecasting is a critical part of any business’s financial planning process. Excel provides powerful tools and features that can be used to accurately forecast a business’s financial performance. To create an accurate financial forecast in Excel, it is important to understand the basics of financial forecasting, estimate future cash flows, and account for risk factors.
Understanding the Basics of Financial Forecasting
Before creating a financial forecast in Excel, it is important to understand the basics of financial forecasting. This includes understanding the different types of forecasts (such as short-term and long-term forecasts), the components of a financial forecast (such as revenues, expenses, taxes, and capital investments), and the factors that can affect a financial forecast (such as economic conditions and industry trends). Understanding the basics of financial forecasting will help you create an accurate forecast in Excel.
Estimating Future Cash Flows
When creating a financial forecast in Excel, it is also important to estimate future cash flows. This includes estimating revenue, expenses, taxes, and capital investments over a certain period of time. Estimating future cash flows is an important part of creating an accurate financial forecast in Excel.
Accounting for Risk Factors
In addition to estimating future cash flows, it is important to account for risk factors when creating a financial forecast in Excel. This includes accounting for things like market fluctuations, currency exchange rates, and political instability. Accounting for these risk factors can help you create a more accurate financial forecast in Excel.
Creating a Financial Forecast from Scratch in Excel
Creating a financial forecast from scratch in Excel is a relatively straightforward process. The first step is to gather the necessary data, such as sales figures, expenses, taxes, and capital investments. Next, you will need to input and organize this data into your spreadsheet. Finally, you can use Excel’s tools and features to analyze the data and create an accurate financial forecast.
Gather the Necessary Data
The first step in creating a financial forecast from scratch in Excel is to gather the necessary data. This data could include sales figures, expenses, taxes, and capital investments. Make sure to collect all of the relevant data before beginning your forecast.
Inputting and Organizing Data
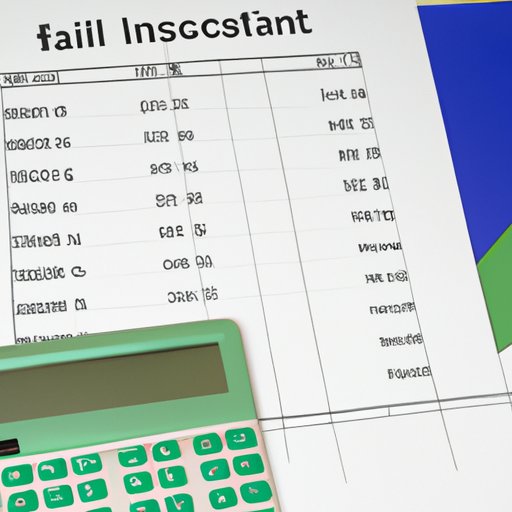
Once you have collected the necessary data, you will need to input and organize it into your spreadsheet. This involves entering the data into the appropriate cells and organizing it into columns and rows. Make sure to label each column and row so that it is easy to reference later.
Analyzing the Data
Once you have inputted and organized your data, you can begin analyzing it. Excel provides a variety of tools and features that can be used to analyze your data and create an accurate financial forecast. This includes formulas, statistical functions, and data visualization tools.
How to Use Excel to Create a Financial Forecast
Creating a financial forecast in Excel is a straightforward process that involves setting up your spreadsheet, defining your variables, calculating your values, and visualizing your results. Additionally, there are several tips and tricks that can be used to make the process easier. These include utilizing formulas, using statistical functions, and exploring data visualization tools. With these tips and tricks, you can use Excel to create an accurate financial forecast.
Automating Your Spreadsheet
One of the best ways to use Excel to create a financial forecast is to automate your spreadsheet. This involves using formulas and functions to automatically update your data as conditions change. Automating your spreadsheet can help you stay up-to-date with changing financial conditions.
Utilizing Charts and Graphs
Excel provides a variety of charts and graphs that can be used to visualize your data. These charts and graphs make it easier to interpret complex financial information and share results with other stakeholders. Utilizing these charts and graphs can help you create a more effective financial forecast.
Staying Up-To-Date
Finally, it is important to stay up-to-date with changing financial conditions when creating a financial forecast in Excel. This involves regularly updating your data and adjusting your assumptions as needed. Staying up-to-date with changing financial conditions can help you create an accurate financial forecast.
Conclusion
Financial forecasting is an important part of any business’s financial planning process. Excel provides powerful tools and features that can be used to accurately forecast a business’s financial performance. To create an accurate financial forecast in Excel, it is important to understand the basics of financial forecasting, estimate future cash flows, and account for risk factors. Additionally, there are several tips and tricks that can be used to make the process easier, such as utilizing formulas, using statistical functions, and exploring data visualization tools. With these tips and tricks, you can use Excel to create an accurate financial forecast.
(Note: Is this article not meeting your expectations? Do you have knowledge or insights to share? Unlock new opportunities and expand your reach by joining our authors team. Click Registration to join us and share your expertise with our readers.)