Introduction
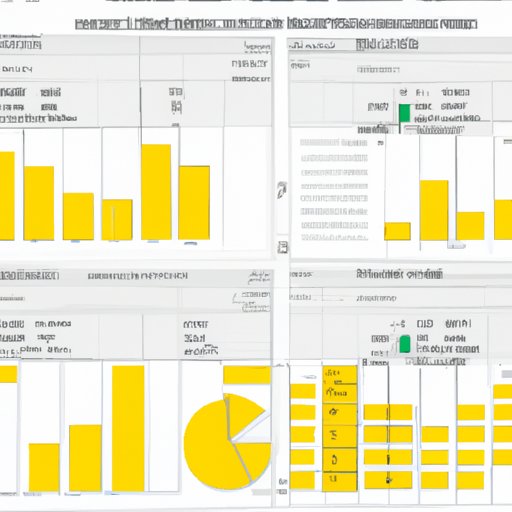
Power BI is a powerful business intelligence tool from Microsoft that enables users to transform raw data into actionable insights. It provides an intuitive platform for capturing, analyzing, and visualizing data, helping businesses make informed decisions quickly and efficiently. By automating reports in Power BI, organizations can save time and resources, streamline workflows, and gain a better understanding of their data.
What is Power BI and Why Should You Automate Reports?
Power BI is a suite of business analytics tools that allow you to access data from multiple sources, create interactive visualizations, and share your insights in real time. With Power BI, you can easily connect to a wide range of data sources, such as databases, spreadsheets, and cloud services. This makes it easier to analyze data and make informed decisions quickly.
Automating reports in Power BI allows you to save time and resources by eliminating the need to manually update and maintain reports. With automated reports, you can set up scheduled refreshes so that your reports are always up-to-date. This helps ensure that you’re working with accurate, up-to-date information, which can help you make more informed decisions.

Benefits of Automating Reports in Power BI
There are several benefits of automating reports in Power BI, including:
- Saving time and resources – Automated reports can help you save time and resources by eliminating the need to manually update and maintain reports.
- Ensuring accuracy – Automated reports help ensure that you’re working with accurate, up-to-date information, which can help you make more informed decisions.
- Streamlining workflows – Automated reports can help streamline workflows by ensuring that all stakeholders have access to the latest information.
- Gaining insights faster – Automated reports enable you to quickly gain insights from your data, allowing you to make decisions quickly and accurately.
Setting Up a Report in Power BI
To set up a report in Power BI, you will need to connect to a data source, create a dataset, and build the report. Here’s a step-by-step guide to setting up a report in Power BI:
Step 1: Connect to a Data Source
The first step is to connect to a data source. Power BI offers a wide range of data sources, including databases, spreadsheets, and cloud services. Select the data source you want to use and then follow the instructions to connect to it.
Step 2: Create a Dataset
Once you’ve connected to the data source, you’ll need to create a dataset. To do this, select the data you want to use and click “Create”. This will create a dataset that contains all the data you selected.
Step 3: Build the Report
Now that you’ve created a dataset, you can start building the report. Power BI offers a range of options for creating visualizations and dashboards. Select the type of visualization or dashboard you want to create and then customize it to meet your needs.
Creating Visualizations and Dashboards in Power BI
Once you’ve set up the report, you’ll need to create visualizations and dashboards in Power BI. Here’s a step-by-step guide to creating visualizations and dashboards in Power BI:
Step 1: Select the Visualization Type
The first step is to select the type of visualization you want to create. Power BI offers a variety of visualization types, including bar charts, line graphs, scatter plots, and more. Select the type of visualization that best suits your needs.
Step 2: Customize the Visualization
Once you’ve selected the type of visualization you want to create, you can customize it to meet your needs. This includes changing the colors, size, labels, and other settings. Make sure to preview the visualization before saving it to ensure that it looks the way you want it to.
Step 3: Create the Dashboard
Once you’ve created the visualizations, you can create the dashboard. To do this, you’ll need to add the visualizations to the dashboard and arrange them in the desired layout. You can also add filters and other elements to the dashboard to make it easier to view and interact with the data.

Scheduling Reports in Power BI
Once you’ve created the report, you can schedule it to be refreshed at regular intervals. This ensures that all stakeholders have access to the latest information. Here’s a step-by-step guide to scheduling reports in Power BI:
Step 1: Set Up Refreshes
The first step is to set up refreshes. In Power BI, you can choose to refresh the report either manually or on a schedule. If you select the latter option, you can choose the frequency and time of day when the report will be refreshed.
Step 2: Set Up Notifications
Once you’ve set up the refreshes, you can set up notifications. This allows you to be notified when the report has been refreshed, or if there are any errors with the refresh process. You can also set up notifications to be sent to other stakeholders, such as team members or clients.
Optimizing Performance of Automated Reports in Power BI
Once you’ve set up the report, you can optimize its performance to ensure that it runs smoothly. Here are some best practices for optimizing the performance of automated reports in Power BI:
- Use query folding whenever possible – Query folding is an optimization technique that allows Power BI to push down queries to the underlying data source. This can help improve the performance of the report.
- Design the report for optimal performance – Design the report to make it easier for Power BI to process the data. This includes avoiding large data sets, using efficient visuals, and simplifying calculations.
- Monitor the performance of the report – Monitor the performance of the report to ensure that it is running smoothly. This can help you identify any potential issues and take corrective action.

Examples of Automated Reports Built with Power BI
Here are some examples of successful automated reports built with Power BI:
- Salesforce Automation – Automate sales reports in Power BI to track sales performance, monitor customer trends, and identify opportunities for improvement.
- Financial Reporting – Automate financial reports in Power BI to gain insights into financial performance, identify areas for cost savings, and forecast future revenue.
- Marketing Performance – Automate marketing reports in Power BI to track campaign performance, analyze customer behavior, and measure ROI.
Conclusion
Automating reports in Power BI can help save time and resources, streamline workflows, and gain a better understanding of your data. This article provided a step-by-step guide to setting up a report, creating visualizations and dashboards, scheduling reports, optimizing performance, and examples of automated reports built with Power BI. For more information, check out the resources below.
Resources for Further Learning
- Microsoft Power BI
- Power BI Documentation
- Getting Started with Power BI
-
(Note: Is this article not meeting your expectations? Do you have knowledge or insights to share? Unlock new opportunities and expand your reach by joining our authors team. Click Registration to join us and share your expertise with our readers.)
